
86% prefer to buy groceries from local ‘kirana’ stores - Axis My India CSI Survey

Axis My India, a leading consumer data intelligence company, released its latest findings of the India Consumer Sentiment Index (CSI), a monthly analysis of consumer perception on a wide range of issues. The November report reveals that sentiments have improved across all 5 sub-indices. Spends across discretionary products increased for 11% of the families, demarcating the highest in the last five months. The survey further highlights that local kirana stores continue to remain the top choice for everyday grocery shopping, view of 86%
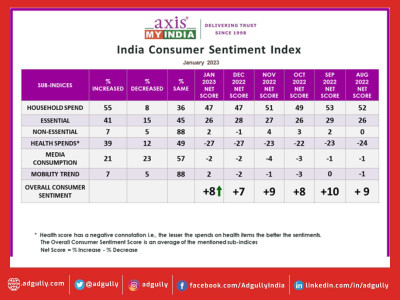
The November net CSI score, calculated by percentage increase minus percentage decrease in sentiment, is at +09, from +08 last month reflecting an increase by 01 point
The sentiment analysis delves into five relevant sub-indices – Overall household spending, spending on essential and non-essential items, spending on healthcare, media consumption habits & mobility trends.
The survey was carried out via Computer-Aided Telephonic Interviews with a sample size of 10207 people across 32 states and UTs. 70% belonged to rural India, while 30% belonged to urban counterparts. In terms of regional spread, 26% belong to the Northern parts while 24% belong to the Eastern parts of India. Moreover 30% and 20% belonged to Western and Southern parts of India respectively. 56% of the respondents were male, while 44% were female. In terms of the two majority sample groups, 28% each reflect the age group of 26YO to 35YO and 36YO to 50YO.
Commenting on the CSI report, Pradeep Gupta, Chairman & MD, Axis My India, said India's steady economic growth and hints of sinking prices have resulted in recovery in consumer confidence. The month-long celebrations have served to amplify this spirit. Convenience and concessions also continue to influence consumer attitudes toward purchases and the demand for goods and services. Online apps are gaining ground in consumers' minds even as local kiranas continue to meet the demand for everyday grocery shopping. Similarly while rebates and discounts are triggering budgeted purchases, the sale of big ticket items are still restricted. Therefore while overall spends provide a positive outlook, one can witness novel behaviours of splurge and scrimp pertaining to categories and mode of purchase.
Key findings:
• Overall household spending has increased for 59% of families which reflects an increase by 1% from last month. The net score which was +49 last month has increased by +2 to +51 this month.
• Spends on essentials like personal care & household items has increased for 46% of the families which is an increase by 2% from last month. The net score which was at +25 last month has increased by +2 to +27 this month
• Spends on non-essential & discretionary products like AC, Car, and Refrigerator has increased for 11% of families which reflects an increase by 2% from last month and the highest increase in the last 5 months. The net score which was at +3 last month has improved to +4 this month showcasing a steady upliftment in spending sentiments.
• Expenses towards health-related items such as vitamins, tests, healthy food has surged for 39% of the families. This reflects an increased consumption by 2% from last month. The health score which has a negative connotation i.e., the lesser the spends on health items the better the sentiments, has a net score value of -23, which is the same as last month.
• Consumption of media (TV, Internet, Radio etc.) has increased for 21% of the families, up by 2% after remaining stagnant at 19% for the last three months. The overall, net score, which was at -3 last month, is at -4 this month.
• Mobility has increased for 7% of the families, which reflects an increase by 1% from last month. The overall mobility net indicator score which was at -2% last month, has reported -1 this month.
On topics of current national interest:
• 86% of households prefer to get their daily groceries from nearby "kirana stores," while only 2% use internet apps to do so. Amongst online apps, 17% of the consumers use Amazon for grocery shopping, while 15% utilise Flipkart. 8% of people favour Jio Mart
• Deep-diving into the sentiment of festivities, the survey discovered that 29% of consumers are planning to shop more or have shopped more in this festive season. 37% preferred to buy more clothes during "sales season" while 23% and 14% preferred to buy groceries and food respectively. Only 6% preferred to buy electronic appliances.
• In terms of jewellery, a huge 17% purchased jewellery in this festive season. 13% have bought from family jeweller shops (local jeweller) and 4% have bought from Hall mark jeweller shops.
• According to Axis My India’s CSI Survey, 61% access the internet daily. With an intent to understand consumers’ internet usage behaviour, the survey further discovered that 29% have used the internet in the last one month to surf through social networking applications (Facebook, Twitter, etc.). 23% each have used the internet as a means of ‘chatting’ (WhatsApp, Messenger, Instagram etc.) and for watching/downloading online videos. In addition, only 8% have used the internet for ‘video calling’ through WhatsApp, Facetime, and Instagram.
• 52% aware that India has recently launched 5G Tech. The survey further revealed 24% of them plans to switch to 5G Phones while 7% have already purchased.
• Further deep-diving into Mobile phone preferences, the survey found out that 15% considers RAM as the most prominent feature while buying it while 14% each consider the brand and the price of the device as important parameters. Camera quality reported to be an important concern for 11%
• In an attempt to understand consumer perception around cricket and its varied tournaments, this month’s CSI report found out that 32% believes that the relevancy of cricket as a sport continues inspite of the quantum of matches being aired. 27% are excited to watch all the matches of the upcoming T-20 Cricket World Cup. In addition another 28% will watch only matches where India is involved & key matches like Semi Final/Final. 69% will prefer to watch the matches on television screens while 28% will watch it on their phone. 6% will watch it on OTT.


Share
Facebook
YouTube
Tweet
Twitter
LinkedIn