

Over 4 mn ad creatives for mobile apps - non-game in H1 2022, down 27% YoY

After the release of the mobile game white paper two weeks ago, SocialPeta released its H1 2022 Mobile App Marketing White Paper, analyzing apps (non-game) in aspects of global market, advertising and marketing, industry data and trends. The report covers 72 countries/regions across the world, 90 mobile marketing channels at home and abroad, and over 1.2 billion mobile marketing data.

- Overview of Global Advertising Market Data
- Dropping in Europe and America, rising in the Asian-Pacific region: A YoY decline of nearly 30% in the total number of creatives
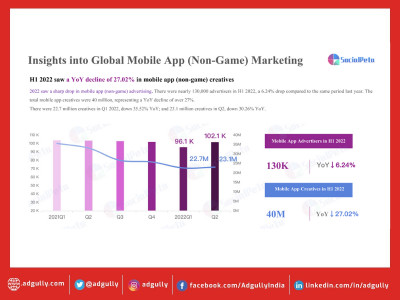
H1 2022 saw over 4 million ad creatives for mobile apps (non-game), down 27% YoY, and over 130,000 advertisers, up 6.24% YoY.
Europe and America and China's mainland reported a significant decline in the number of app advertisers, down 44% YoY in China's mainland, down 15% YoY in Europe, and down 22% YoY in North America. The Asian-Pacific region (except China's mainland) recorded a significant increase in the number of app advertisers, among which, China's Hong Kong, Macao, and Taiwan regions had a YoY growth of nearly 40% in the number of advertisers.
- Reading apps had 800 monthly creatives, 2 times the number of the creatives for social apps
Among all the app types in H1 2022, shopping apps had the most advertisers and creatives, with shopping app advertisers accounting for 12.55% and shopping app creatives accounting for 17.19%.
Reading apps had the highest demands for creatives, with 808 creatives released by each advertiser in one month, which is double the number of the creatives for social apps ranking No.2.
- App Store's downloads, revenue, and advertising charts
- Top apps were mostly tools, shopping, and social apps.
-
- Reading apps had an outstanding number of creatives; [TikTok] dominated the American marke
- Overview of global mobile app marketing in popular countries/region
- There were surging demands for global pan entertainment, leading to a rapid growth of online fiction market. In America, reading app creatives increased by over 6% YoY. Office business app advertisers accounted for the highest percentage of 12.90%; News, reading and weather app advertisers all accounted for about 1%, but their creatives all accounted for about 8%.
-
- Data Analysis of advertising platforms
In the first half of the year, Facebook had over 128,000 app advertisers. Compared to H1 2021, there was a YoY decline of 9.42% in the number of app advertisers on all Meta platforms. On the platforms, shopping app advertisers were the most, accounting for 14.35%; followed by lifestyle app and office business app advertisers, accounting for 11.80% and 11.35%, respectively.
News apps topped the list of advertisers on Meta platforms, and apps on the Top 10 chart were mainly tools, news and social apps.
-
- Cost intelligence in the App Market
- CPM increased by 64% MoM; 3 countries had a CPM of over $10
Overall, the advertising cost of mobile apps continued to rise in H1 2022, with an average CPM of $9.16, up 64% MoM; an average CPC of $0.93, up 181% MoM; an average CTR of 2.74%, up 22% MoM.
The US had the highest advertising cost for mobile apps, with an average CPM of $11.88, CPC of $1.8, and CTR of 2.79%. Three countries/regions including Australia and Singapore had a CPM of over $10. Singapore had the highest advertising cost in the Asia-Pacific region, followed by South Korea and Japan.
-
- Analysis of App Creatives
- As the global demands for pan entertainment rose, short video, live streaming, entertainment platforms suffered from serious involution
TikTok, Bigo Live, and other short video apps, and live streaming platforms have changed Meta-platforms' dominant position, leading to fierce competition among thousands of live streaming platforms.
-
Creatives for tools apps are mostly in real-life scenes, highlighting the app’s powerful exclusive functions.
-
Finance apps tend to have real people in their creatives to earn customers' trust.
-
- To avoid fierce competition, app globalization should seek opportunities in T3 market
- App Industry Trends : T3 market has sped up the construction of its digital infrastructure after the COVID-19. The financial technology, e-commerce, social interactions and entertainment, game, and other industries in many T3 markets are worth much attention. For example, thanks to the huge demand for financial technology services and the government's strong support, Mexico's financial technology business has grown rapidly to become one of the major financial technology systems in Latin America.
- Online media has more opportunities
The market of online media including global video, music and game apps will be expected to expand from $17 billion (about 110.09 billion RMB) in 2020 to $35 billion (about 226.65 billion RMB) in 2025. Such a huge market has attracted many competitors.
- The combination of Metaverse and social apps
Since the metaverse concept became a sensation, there has been a new "metaverse" app released each day. From November 2021 to January 2022, there had been 552 apps labeled "metaverse". But those apps were coarsely and quickly made, and there hasn't been an official definition of metaverse apps. So metaverse social apps are still at a very early stage, and there is still a very big gap to fill before metaverse has a great profit potential or becomes a big hit.
This report's data cover 72 countries/regions worldwide, with over 90 mobile marketing platforms across the world and totally over 1.2 billion mobile marketing creatives. You can download the full report to know more about the industry data and growth opportunities for apps.
- To avoid fierce competition, app globalization should seek opportunities in T3 market


Share
Facebook
YouTube
Tweet
Twitter
LinkedIn