
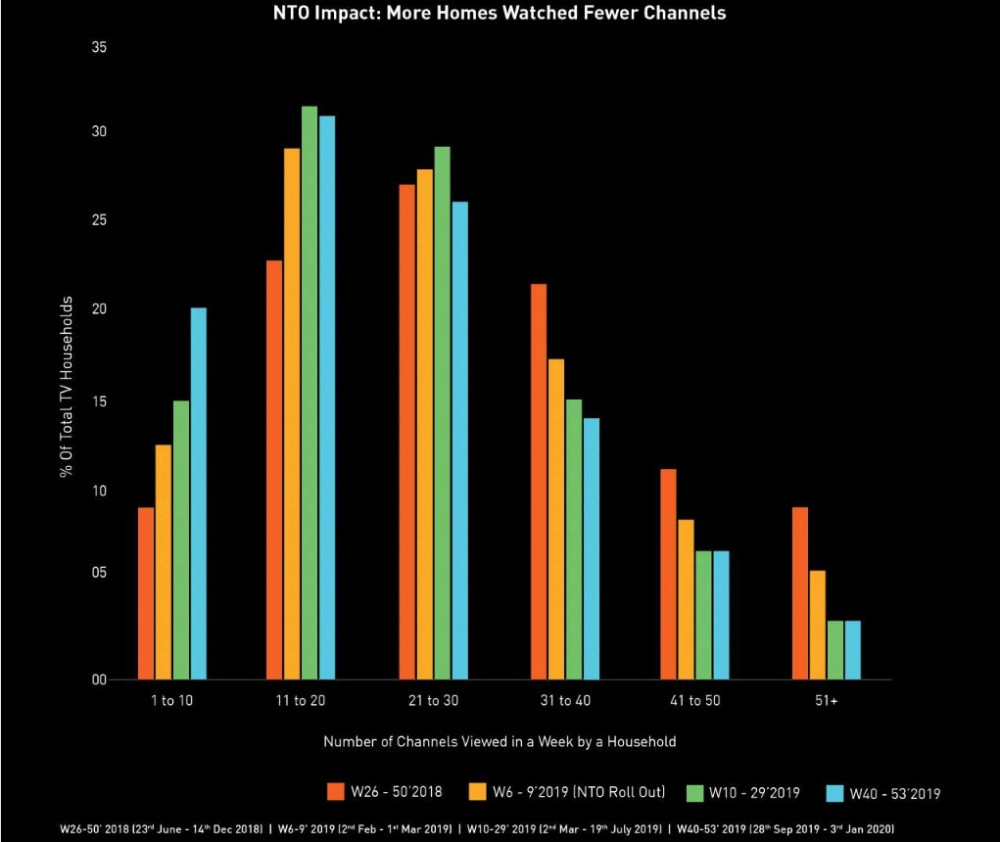
More homes watched fewer channels post NTO: BARC
TV viewership has grown by 38% over the last four years. At any given minute, 222 million viewers tune in to watch primetime television and the average household spends 5 hours 11 minutes on the TV every day. According to BARC India's report on 'What India Watched 2019', 2019 was a disruptive year for the broadcast sector, with the implementation of the New Tariff Order (NTO). The same year was peppered with mega events such as Elections, IPL 2019 and the ICC Cricket World Cup. BARC measured 634 channels, which generated 48.4 trillion television viewing minutes and 1.59 billion seconds of advertising.
Sports coverage in regional languages saw a boost. The states of Assam, the rest of the North East, Andhra Pradesh, Telangana and Tamil Nadu contributed the most to this surge.
Ad Free Commercial Time (FCT), which stood at 1.6 billion seconds in 2018, fell by 3.6% in 2019. The share of top 10 advertisers in the same year grew by 3.8%.
Sunil Lulla, CEO, BARC India, observed, “With over 100 million homes in India yet to get a TV set, growth continues to be ahead of us.”
TV Viewership in 2019
TV ownership and viewing continues to grow to see a robust growth in all areas. According to the report, 836 million individuals have access to a TV set in the country. 762 million viewers tune in every week to watch TV spending at least 3 hours 42 minutes every day in watch time. This adds up to 914 billion minutes of total viewing minutes every week.
From an advertising perspective, 11525 advertisers are now leveraging broadcast medium with volume of advertising reaching 1.59 billion seconds in 2019.
With marquee events lined up throughout the year, TV viewership set some new records on specific days.
On Counting Day (23rd May) for the Lok Sabha Elections 2019 viewers consumed 59 billion viewing minutes of the News Genre, which contributed to 38% of overall TV viewership for that day.
In 2019, 26,080 movie titles aired across movie channels out of which the 4 South Indian languages contributed 48% of these unique movie titles. The premiere of Housefull 4 on Star Gold was the most watched premiere clocking 4.1 billion minutes of watch time.
The 2019 ICC Cricket World Cup match between India and Pakistan is the most watched game between 2016-2019 garnering 29.4 billion viewing minutes.
Prime Minister Narendra Modi’s visit to Houston, Texas on September 22 (Howdy Modi) was telecast on 163 channels and 69 million viewers watched the broadcast. The coverage of the event clocked 2.3 billion viewing minutes across news channels.
TV Over The Years
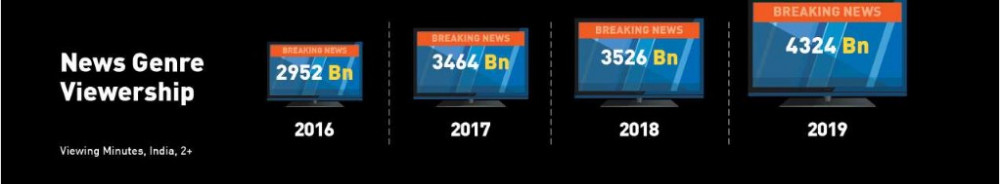
From 35 trillion minutes of viewing in 2016 to 48.4 trillion minutes of viewing, TV viewership has seen a robust growth in watch time in the last 4 years. TV viewership has grown across categories starting with GEC (28%), Movies (47%), News (46%), Kids (56%), Music (86%), Sports (89%), Niche/Others (52%).
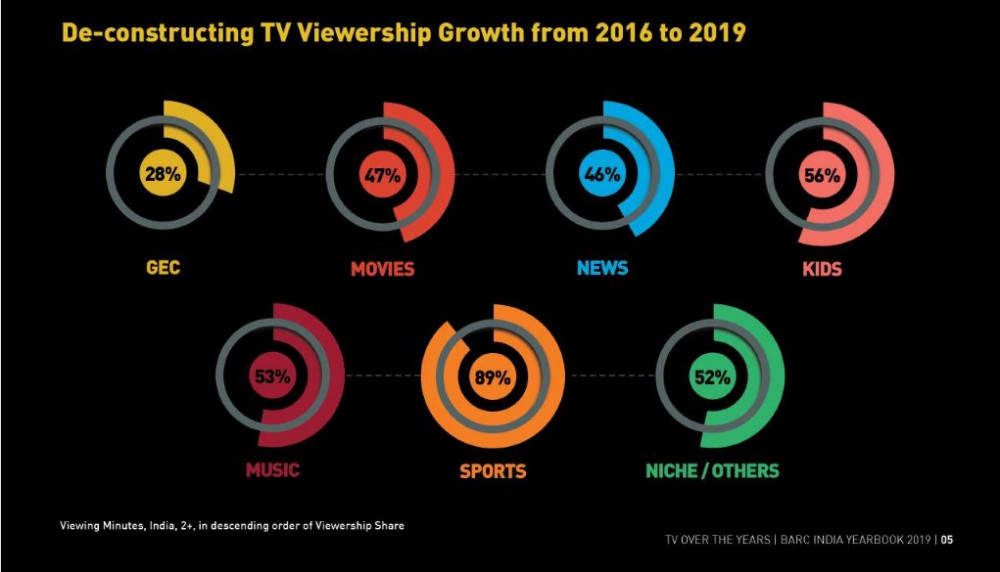
Apart from GEC viewing, all other categories have increased watch time by 50% and higher. The report finds that this strong growth has come on the back of regional markets on the back of factors like availability of, and affinity towards local language content. Viewership in Assam, North East, Sikkim grew by 119% (doubled) and contributed to 3% of total TV viewership in 2019.
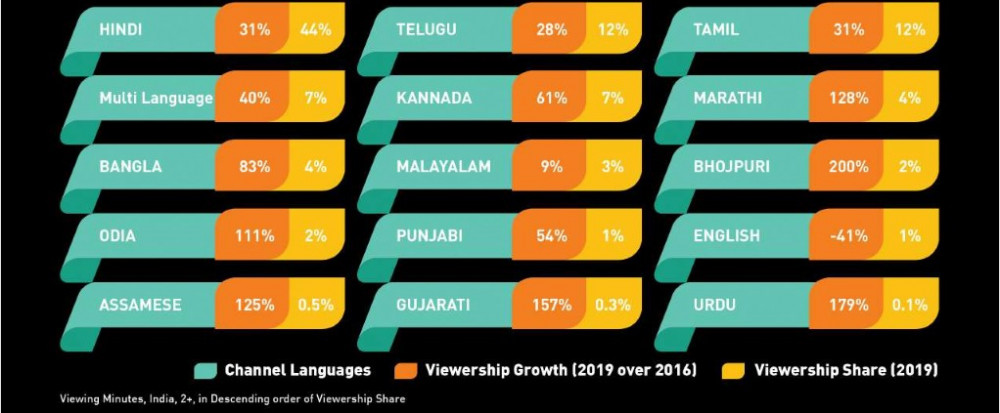
The share of South Indian language content has also grown from 15% in 2016 to 23% in 2019. Viewership of most regional channels have doubled in the same period.
The report did find that English language channels have seen a decline in viewership of -41%. This has been attributed to availability of sports content in regional languages thus decreasing the eyeballs on the English telecast.
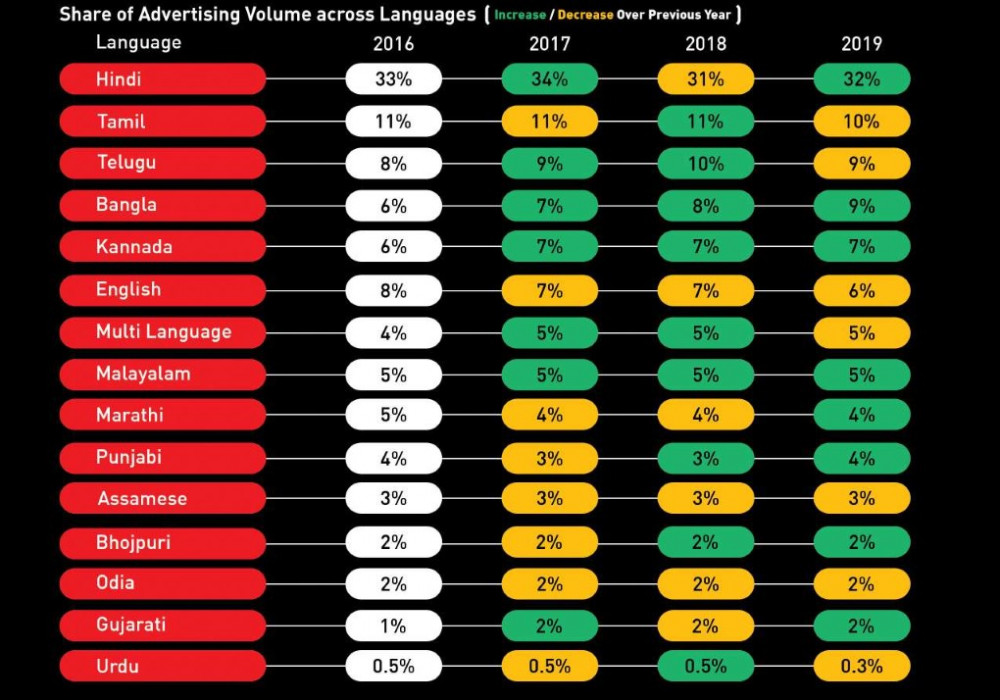
The volume of advertising on Television has grown by 21% (2016-2019). The share of advertising on regional channels has gone up, which is a strong indicator of the rise of regional content. Table below shows the growth/degrowth in advertising volumes in languages over the previous year.
News, General Entertainment and Movies contribute for over 3/4th of total advertising volumes. Table below shows the growth/degrowth in advertising volumes in these categories over the previous year.

The news genre grew by 23% in 2019 over the previous year accounting for 8.9% of total TV viewing gaining the highest share compared to the previous four years. What contributed to this increased share? The report suggests General Elections, polls to elect 7 State Assemblies, Pulwama Terror Attack, Balakot Air Strikes, Triple Talaq verdict, Section 370, Floods, Ardh Kumbh Mela, Chandrayaan 2, Ayodhya Verdict, capture of Wing Commander Abhinandan Varthaman, and Citizen Amendment Bill made it an exceptionally newsy year.
Table below shows growth in news genre viewing minutes over the last four years.
States including Maharashtra, Goa, Andhra Pradesh, Telangana, Karnataka, Tamil Nadu, Pondicherry, Uttar Pradesh, and Uttarakhand contributed to 52% of total news viewership in 2019.
New Tariff Framework
The Telecom Regulatory Authority of India (TRAI) implemented the new tariff regime which came into force on February 1st 2019. Under the new regulatory framework, the consumer was given the freedom to select the channel of his choice.
Subscribers of DTH and Digital Cable TV services could opt for channels as per A La Carte basis or pick a bouquet of channels which would be heavily discounted. The viewer would also have access to a mandated base of Free To Air channels (not including DD channels) at a fixed cost termed at Network Connection Fee (NCF).
While BARC reports that viewership has remained mostly stable post the rollout of NTO, a trend has emerged where there has been a drop in percentage of households watching 30 or more channels on average per week.
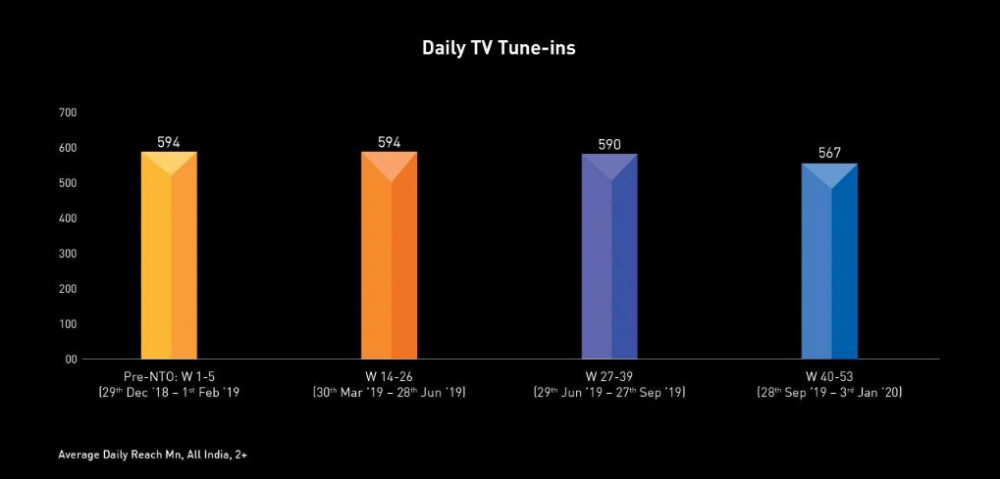
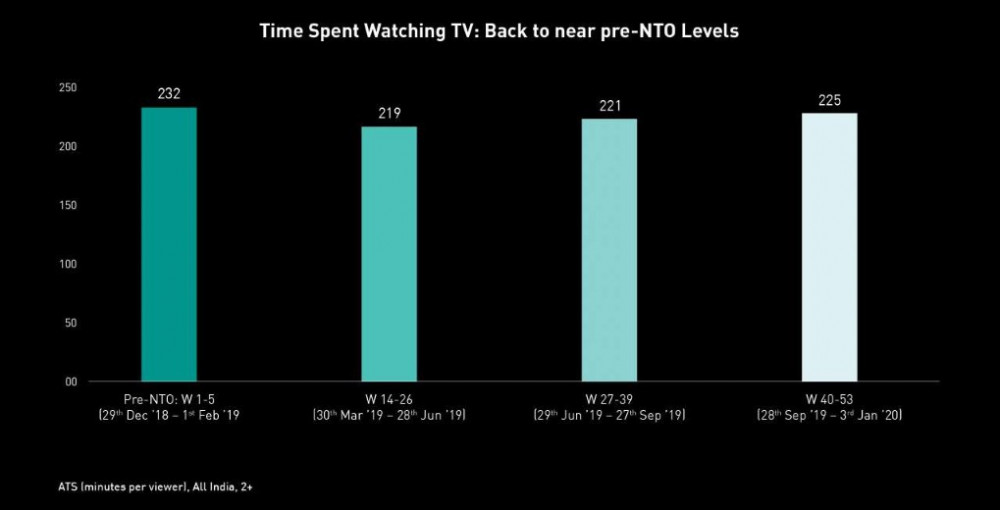
Post NTO, average daily reach dropped by 5%. After a small dip in the early phase of transition, time spent watching TV by an average individual climbed back to earlier levels.
Also Read:
Stakeholders need to transition to NTO 2.0 in a time bound manner: TRAI
TRAI defends NTO 2.0, insists it provides freedom to stakeholders


Share
Facebook
YouTube
Tweet
Twitter
LinkedIn